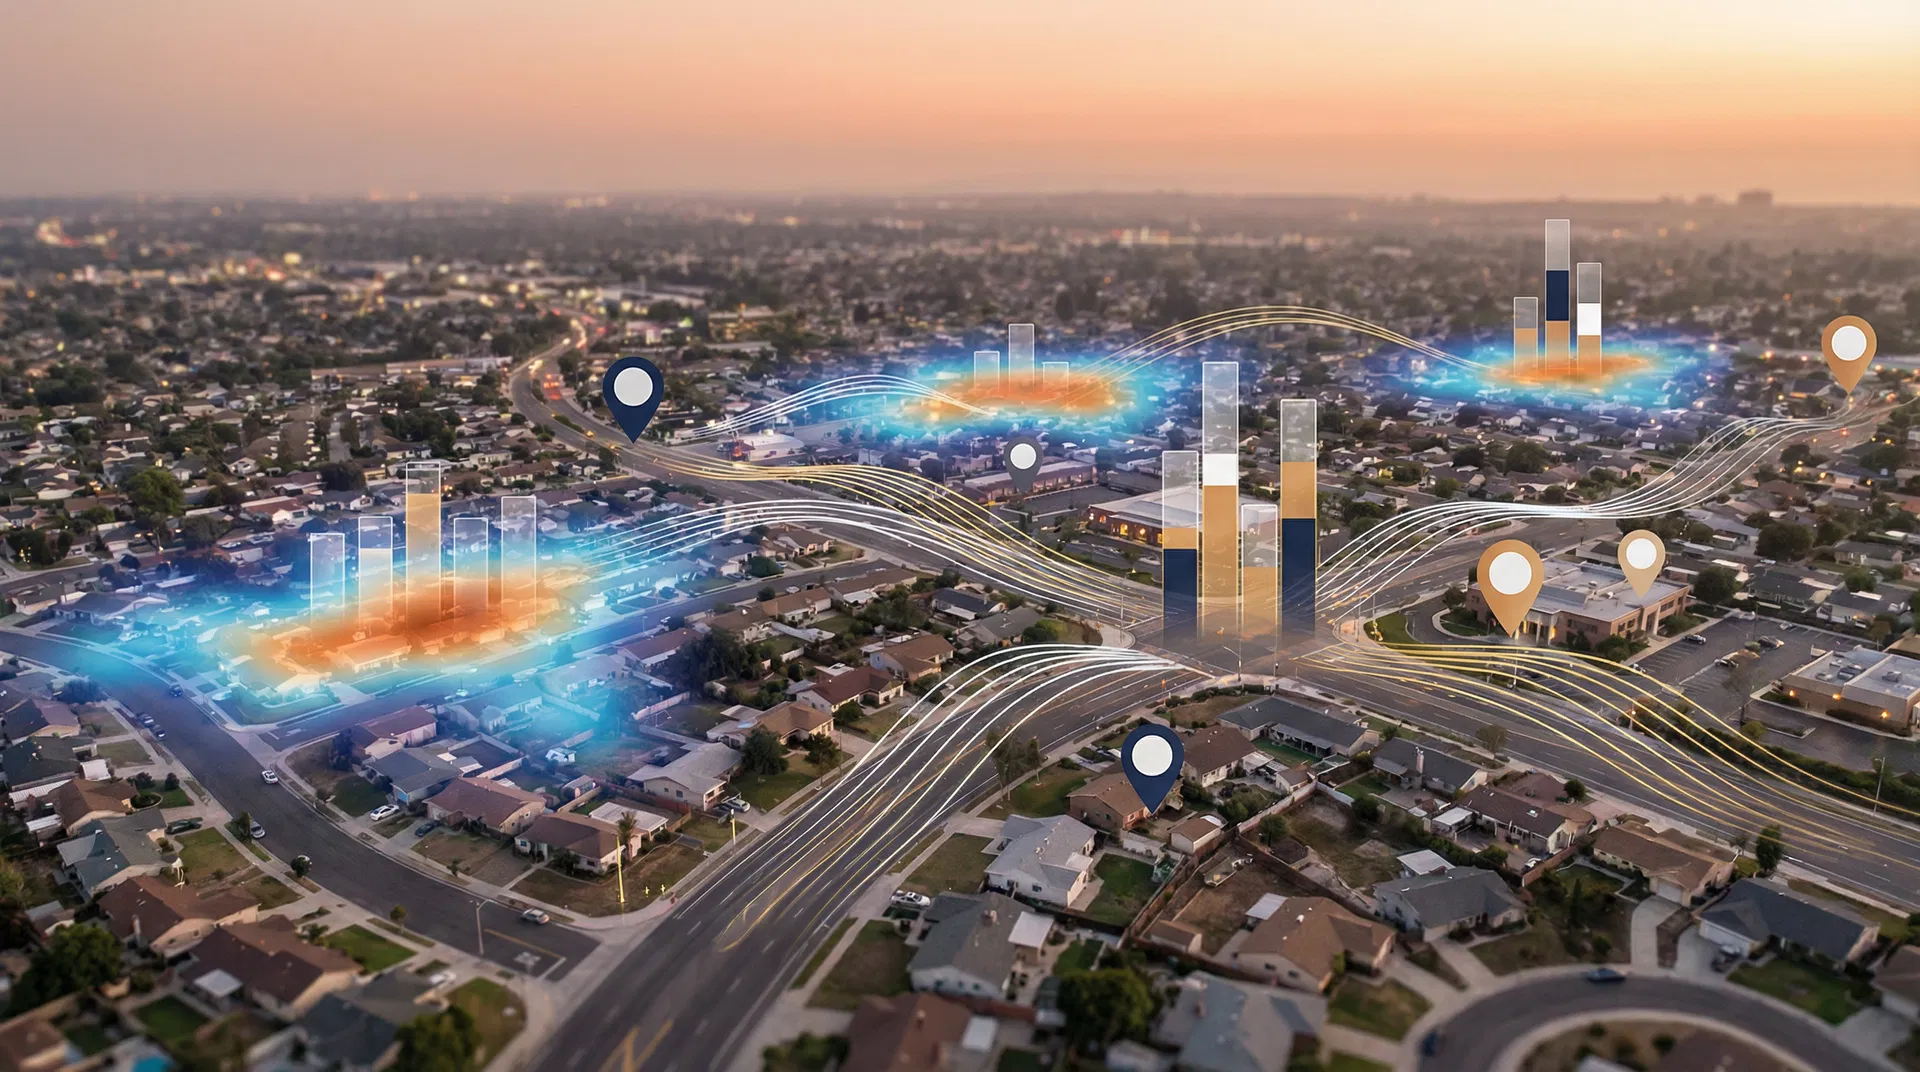
What 203,530 Service Requests Reveal About Life in Riverside
We analyzed every service request filed in Riverside since 2009 — 203,530 records across 30 neighborhoods and 7 wards. The data reveals a city where some communities wait years for basic repairs while others see issues resolved in days.
Between 2009 and early 2026, residents of Riverside, California filed 203,530 service requests through the city's 311 system. Every pothole reported, every streetlight outage, every illegal dumping complaint — all of it is recorded in the city's open data portal. We downloaded the entire dataset and analyzed it to answer one question: Is the City of Riverside serving all of its residents equally?
The answer is complicated. Here are the 15 most important findings.
1. Over 203,000 Service Requests — and Counting
Riverside's 311 system has processed 203,530 requests spanning 254 distinct service types, filed across 30 neighborhoods and 7 city council wards. The volume has accelerated in recent years, with February 2026 setting the all-time monthly record at 4,045 requests in a single month. This is not a city where residents stay quiet — they report problems. The question is whether the city responds equally everywhere.
2. Illegal Dumping Is Riverside's Number One Problem
Of all 203,530 requests, 22,112 are related to illegal dumping — 10.9% of every service call the city has ever received. This includes dumping on public rights-of-way (PROW), private property, and vacant lots. Ward 7 alone accounts for 2,217 PROW dumping reports. Ward 6 handles 42.9% of all shopping cart dumping complaints citywide. The scale of the problem suggests systemic issues with waste management access, enforcement, and community resources — not just individual bad actors.
3. Potholes: 400 Still Waiting, Some Since 2011
Riverside has received 10,526 pothole reports since 2009. Of those, 400 remain unresolved. The oldest open pothole request dates to 2011 — meaning a road hazard has been documented for over 14 years without repair. Ward 3 leads with 107 open potholes, more than double any other ward. The citywide average resolution time masks enormous ward-level disparities: some neighborhoods see potholes filled within weeks, while others wait years.
Our interactive pothole map plots all 400 unresolved locations so you can check if your street is on the list.
4. Homeless Encampment Reports Have Surged 484%
In 2023, Riverside received 521 homeless encampment reports. By 2025, that number had exploded to 3,043 — a 484% increase in just two years. This is the fastest-growing service category in the entire dataset. The surge reflects both a genuine increase in visible homelessness and a community that increasingly uses the 311 system to report encampments. Either way, the data shows a crisis that is accelerating, not stabilizing.
5. 33,005 Parking Complaints — 16.2% of All Requests
Parking-related issues account for 33,005 requests — the second-largest category after infrastructure. This includes abandoned vehicles, illegal parking, and oversized vehicle complaints. The volume suggests that parking enforcement is a persistent quality-of-life concern across the city, particularly in denser neighborhoods where street parking is limited.
6. The Backlog Is Real: 4,523 Requests Sit Unresolved
At the time of our analysis, 4,523 service requests remain open across all categories. The oldest dates to January 5, 2009 — a sidewalk repair request that has been open for over 17 years. The backlog is not evenly distributed: Ward 1 carries the largest open caseload at 4,246 items, while some wards have fewer than 2,000. The existence of a 17-year-old open request raises serious questions about how the city prioritizes and tracks its maintenance obligations.
7. Sidewalk Damage: The Worst Resolution Rate of Any Category
Damaged sidewalks have the worst resolution rate in the entire dataset. Out of 3,599 total sidewalk repair requests, 1,607 remain unresolved — a 44.7% failure rate. No other service category comes close to this level of neglect. The raw data includes every open record with address, ward, neighborhood, and days waiting.
A Reddit post from December 2025 about a Riverside sidewalk measuring only 29 inches wide — against the city's 48-inch ADA requirement — drew 2,100 upvotes and 112 comments, showing how deeply this issue resonates with residents.
The city approved a $5.6M sidewalk repair contract in January 2026, but with 1,607 open requests, the investment may not be sufficient. Our interactive sidewalk map shows every unresolved location.
8. Ward 1 Generates the Most Requests — By Far
Ward 1 has filed 43,138 service requests — 21.2% of the citywide total. That is more than double the volume of the lowest-reporting ward. Ward 1 includes some of Riverside's oldest and most densely populated neighborhoods, which partly explains the volume. But it also suggests that infrastructure in Ward 1 is aging faster than the city's ability to maintain it.
| Ward | Total Requests | Share of Citywide Total |
|------|---------------|------------------------|
| Ward 1 | 43,138 | 21.2% |
| Ward 3 | 36,128 | 17.8% |
| Ward 2 | 30,107 | 14.8% |
| Ward 5 | 27,368 | 13.5% |
| Ward 6 | 26,753 | 13.2% |
| Ward 4 | 18,380 | 9.0% |
| Ward 7 | 21,636 | 10.6% |
9. The Closure Rate Varies by Ward
Not all wards resolve their requests at the same rate. Ward 6 leads with a 91.1% closure rate, while Ward 7 trails at 88.5%. A 2.6 percentage point gap may sound small, but applied to tens of thousands of requests, it means hundreds of additional unresolved issues in the lowest-performing wards. The data does not explain why the gap exists — whether it reflects staffing allocation, geographic challenges, or political priorities — but it confirms that the gap is real and measurable.
10. One Address Has Generated 1,908 Requests
The single most-reported address in Riverside is 3200 Brockton Avenue, with 1,908 service requests. This is likely a commercial or institutional property that generates repeated maintenance issues. The concentration of requests at a single location raises questions about whether the city has a strategy for addressing chronic problem sites rather than treating each request as an isolated incident.
11. Street Lights Are Riverside's Number One Utility Concern
11,787 streetlight outage reports make this the largest single utility-related category. Broken streetlights are more than an inconvenience — they are a public safety issue that affects pedestrian visibility, crime deterrence, and community perception of neighborhood quality. The volume suggests that Riverside's streetlight infrastructure may need systematic investment rather than reactive repair.
12. Animal Control Handles 12,247 Requests
Animal-related service calls — stray animals, barking complaints, and wildlife encounters — account for 12,247 requests. This makes animal control one of the top five service categories by volume, reflecting the reality that animal management is a significant municipal responsibility that often goes unrecognized in infrastructure discussions.
13. Tuesday Is the Busiest Day — Sunday Is the Quietest
Service request filing follows a clear weekly pattern. Tuesday is the busiest day with 39,798 total requests filed on Tuesdays over the dataset's lifespan, while Sunday is the quietest at just 7,447. The pattern suggests that residents file requests at the start of the work week, possibly after noticing issues over the weekend. City staffing and response capacity should align with this pattern.
14. February 2026 Set the Monthly Record
4,045 service requests were filed in February 2026 alone — the highest single-month total in the dataset's history. Whether this reflects increased awareness of the 311 system, worsening infrastructure conditions, or seasonal factors (winter storms damaging roads), the trend line is clear: request volume is growing, not shrinking. The city's maintenance capacity must grow with it.
15. The Data Tells a Story of Inequity
When you layer all 15 data points together, a pattern emerges. The wards with the most service requests do not always get the fastest resolution. The neighborhoods with the oldest backlogs are often the ones with the least political visibility. The categories with the worst resolution rates — sidewalks, potholes — are the ones that most directly affect pedestrians, cyclists, and people who depend on walking infrastructure rather than cars.
This is not an accusation. It is a measurement. The data is public, the patterns are clear, and the questions deserve answers.
What You Can Do
Know your ward. Every Riverside resident lives in one of seven council wards. Your ward representative is your direct line to city services. Find yours at the City of Riverside website.
Know your data. The service request data we analyzed is publicly available through the City of Riverside's open data portal. You have the right to see how your tax dollars are being spent — and how quickly your neighborhood's problems are being addressed.
Use the tools. Our interactive maps show every unresolved pothole and sidewalk request in the city. Check if your street is on the list. If it is, contact your council member with the data in hand.
Engage with your community. Join the conversation on Every Place Counts. Share your experience, vote in community polls, and help us build a more transparent picture of infrastructure equity in the Inland Empire.
This analysis was produced by Every Place Counts using publicly available data from the City of Riverside's open data portal. All data points are verifiable through the original source. We believe informed communities make better decisions.
Sources: City of Riverside Open Data Portal (203,530 service request records, 2009-2026); Reddit r/InlandEmpire community discussion (December 2025); Raincross Gazette (March 2026); City of Riverside Mayor's Office press release (May 2025).